Solutions
Eight teams, one day at Newspeak House, roughly five build hours each. This is what they built: a policy brief, a dashboard, or a model, worked from London's own planning and housing data. All eight were cloned fresh, run locally, and screenshotted on 2026-08-08 for this report; a ninth submission (an Android AR app) is out of scope for a data-analysis review and isn't covered here.
Rigor varied more than polish did. Three teams (The Spike, London Land Ledger, TA Watch) shipped explicit limitations sections, stated data-quality gates, and falsification checks; two of the most visually polished submissions were the least independently auditable. Where that matters for a specific project, it's noted below rather than smoothed over. Full detail, including independent follow-up checks against fresher data, is in the conclusions page.
1. The Spike
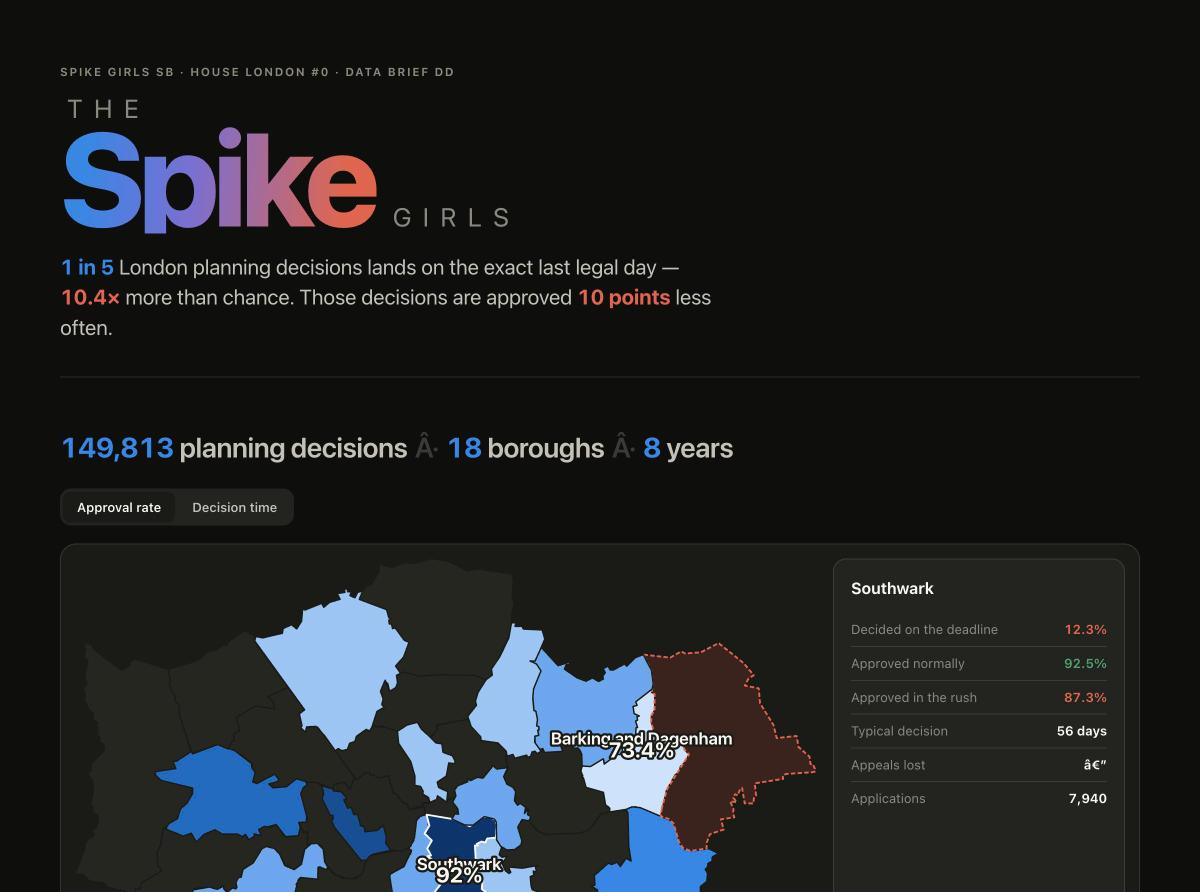
Brief DD · Team Spike Girls SB · static HTML/JS + Python/sklearn
London councils are judged on deciding planning applications within a statutory 8-week deadline. Using 343,141 scraped PlanIt applications, this project shows councils hit that target by deciding on the last legal day at 10.4× the rate the surrounding days would predict, and that decisions made in that rush are approved roughly 10 points less often (71.9% vs 82.1%) across 16 of 18 boroughs studied. A second model shows the application's own text predicts approval (ROC-AUC 0.71) almost as well as text plus location combined, while a third predicts how long a decision will take.
Key finding: what you propose predicts approval better than where you propose it; borough and application type add almost nothing once the description text is in the model. The recommended fix is to replace "% decided within 8 weeks" with an appeal-survival or quality-adjusted metric, since the current one is demonstrably gameable.
GitHub
2. London's Housing Pipeline
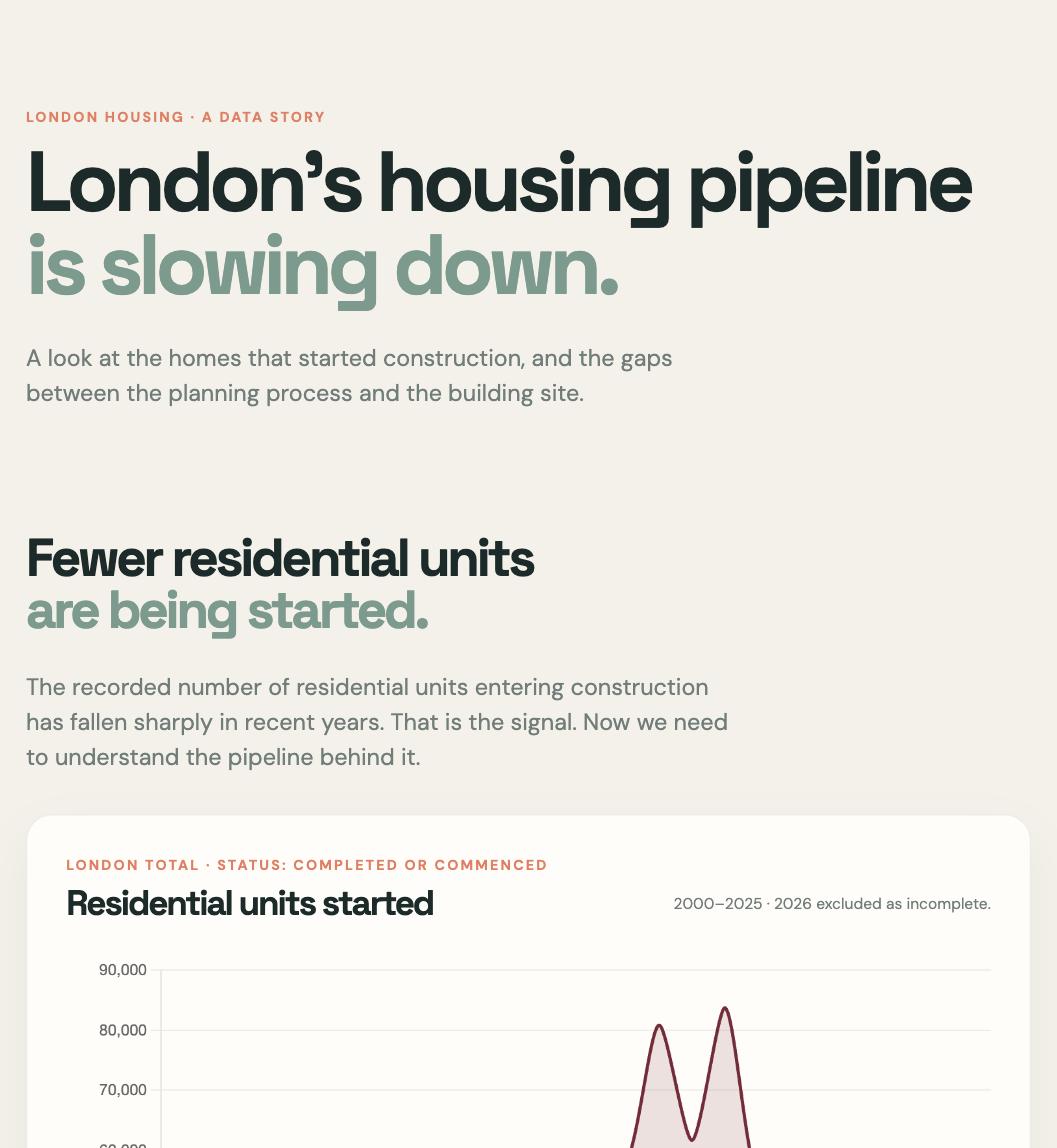
Brief not stated · vanilla JS + Chart.js + Python fetch script
Uses the official Planning London Datahub (GLA) API directly, a different and more granular source than PlanIt that tracks the full lifecycle from submission through to actual construction start and completion. Its headline claim is that recorded residential unit starts have fallen sharply in recent years, but it explicitly interrogates its own data quality before endorsing that as a real trend: the share of records carrying all three lifecycle dates rises from under 10% before 2010 to over 95% by 2024, meaning older-year delay statistics rest on a small, non-random subset of records.
Key finding: residential starts are genuinely down, but the size of the very-recent-year drop should be treated as an upper bound until enough time has passed for records to catch up. One of the few submissions to build a data-completeness diagnostic into the headline chart rather than a caveats section.
GitHub
3. Borough Approval Rate Analysis
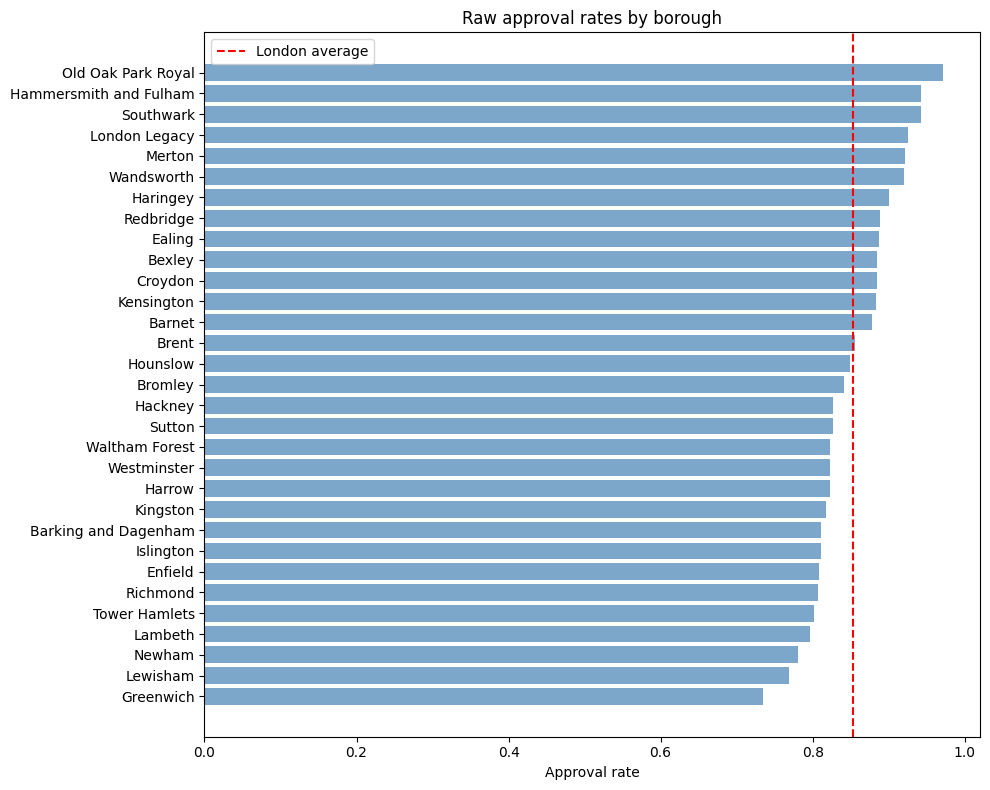
Brief not stated, no team name · single Jupyter notebook
The simplest and least productised of the eight: one notebook asking whether London's borough-to-borough variation in planning approval rates is real, or just an artifact of different boroughs receiving different kinds of application. A logistic regression with borough and application type as covariates finds borough effects survive controlling for application mix: Southwark is +1.45 log-odds relative to the reference borough, Greenwich −0.59, despite Greenwich receiving an easier-than-average application mix.
Key finding: borough identity itself, not the mix of applications a borough happens to receive, drives outcome variation, the same substantive conclusion The Spike reaches independently via a much heavier ML pipeline. Speed of decision and strictness of decision are separate axes (Spearman r=0.10): being slow doesn't predict being strict.
GitHub (private: WhereToBuild data use restrictions)
4. Homes vs Hotels
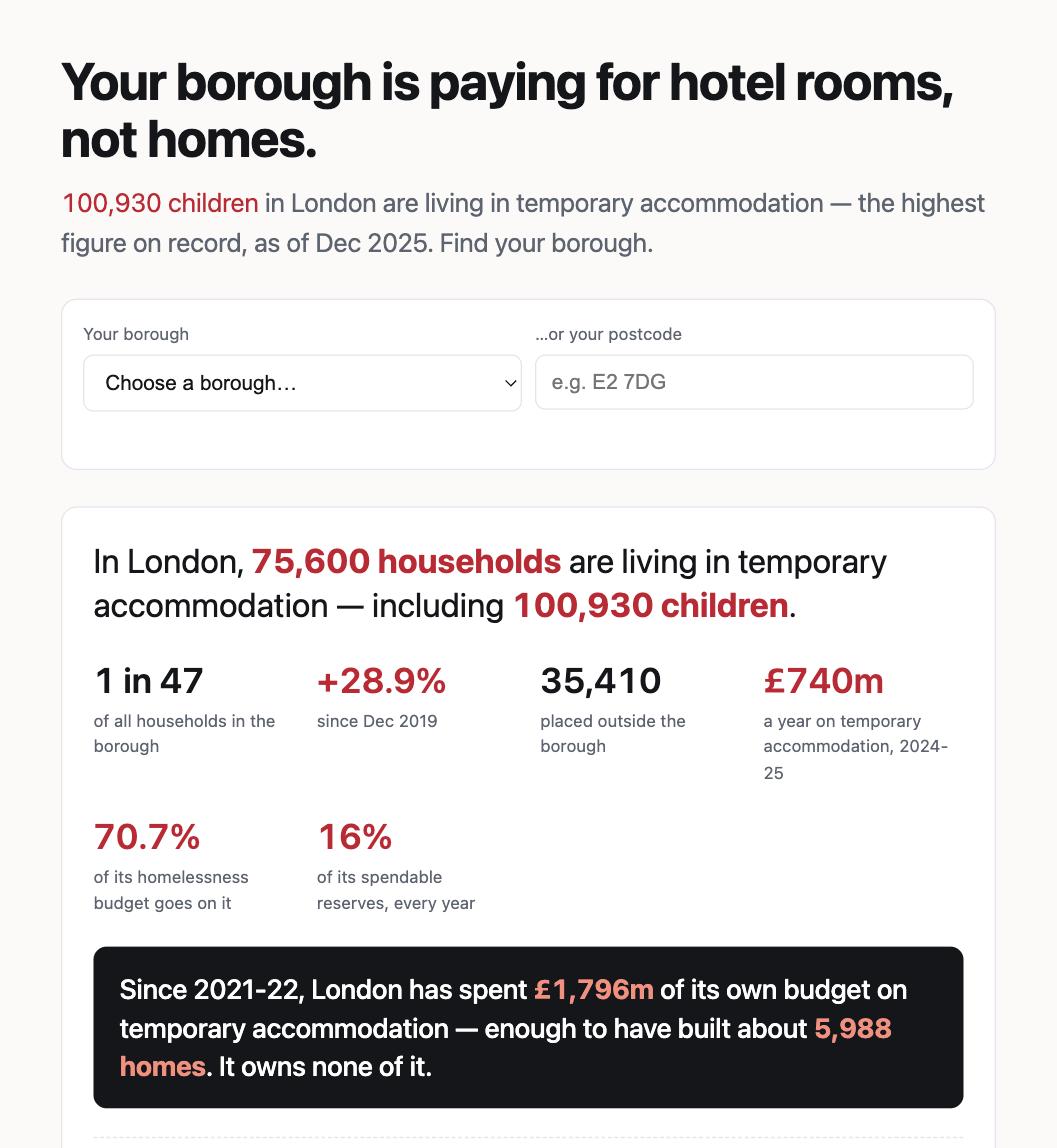
Brief PD × DE · Python build pipeline → static site
London has 100,930 children in temporary accommodation, the highest figure on record; boroughs now spend £740m a year of their own money on it, roughly triple the 2021-22 figure. Over the same period London approved 320,203 homes and completed only 184,169. The tool is a borough-by-borough lookup, by dropdown or postcode, pairing what a borough spends on accommodation it doesn't own against homes it approved and never built, ending in a pre-written email to the user's councillor.
Key finding: across 31 boroughs, TA pressure and failure-to-start approved homes are statistically unrelated (rank correlation −0.21, p=0.25). London's pipeline isn't pointed at London's need: a targeting problem, not simply a blame problem.
GitHub
5. London Land Ledger
Brief DB · Python build pipeline + Leaflet
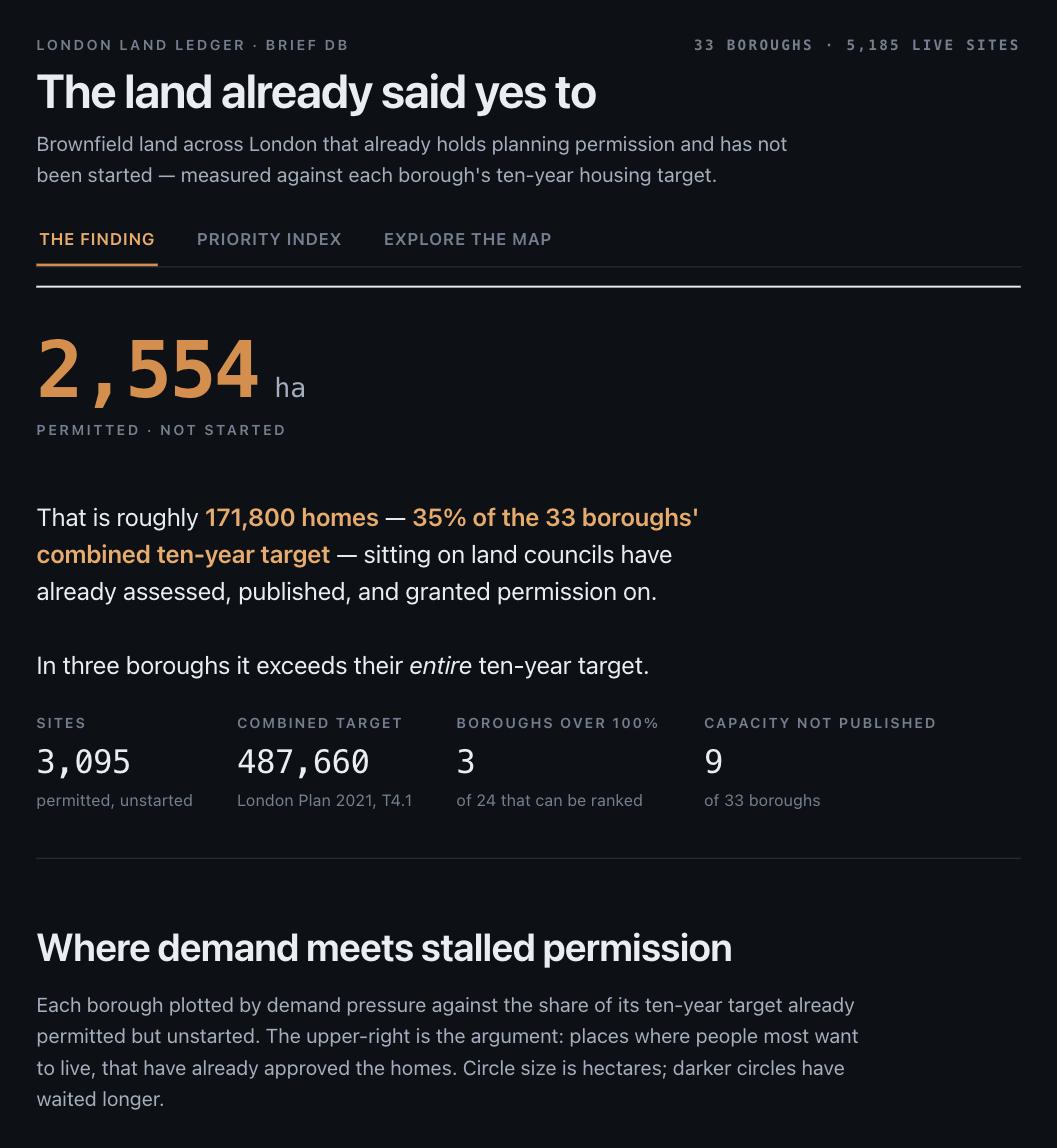
2,554 hectares of London brownfield land already holds planning permission and has not been started: roughly 171,800 homes, 35% of the 33 boroughs' combined ten-year housing target, on land councils have already said yes to. Three boroughs (Kensington and Chelsea, Barking and Dagenham, Camden) individually hold more unstarted permitted capacity than their entire ten-year target. The project's "honesty requirements" section is the most rigorous of any submission reviewed: boroughs that publish no capacity figure are shown as not-published rather than zero.
Key finding: for a materially-sized subset of London boroughs, the housing shortfall isn't explained by a lack of buildable, permitted land. This session's own follow-up found the 171,800 figure is probably an overestimate (two of its top-15 sites turned out to already be under construction), but the underlying pattern holds; see the conclusions page.
GitHub
6. Where Should London Build?
Brief DB · single self-contained HTML file + Python build pipeline
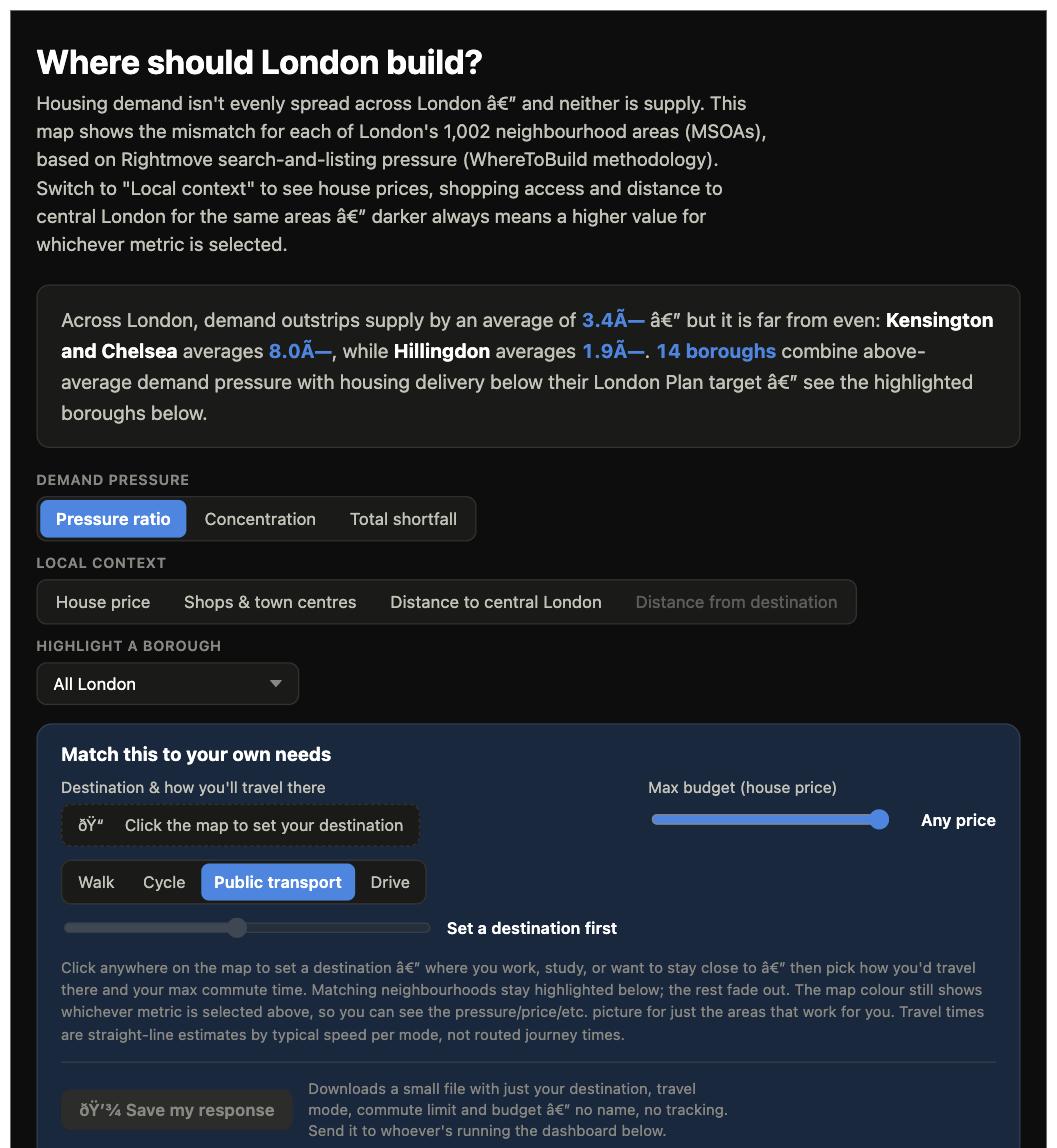
An independent second answer to the same Brief DB as London Land Ledger, built from the demand side: an interactive map of all 1,002 Greater London MSOAs coloured by a demand/supply pressure ratio, layered with house price and amenity-access context, plus a personal needs-matching tool and a councillor-facing dashboard aggregating residents' saved criteria. Ships as one offline-capable HTML file specifically so a councillor can open it with zero setup.
Key finding: demand outstrips supply by 3.4× on average across London, ranging from 1.9× (Hillingdon) to 8.0× (Kensington and Chelsea); 14 boroughs combine above-average demand pressure with delivery below their London Plan target.
GitHub (private: WhereToBuild data use restrictions)
7. Stalled London
Brief inferred: DE + DH-style · TanStack Start (React 19 SSR)
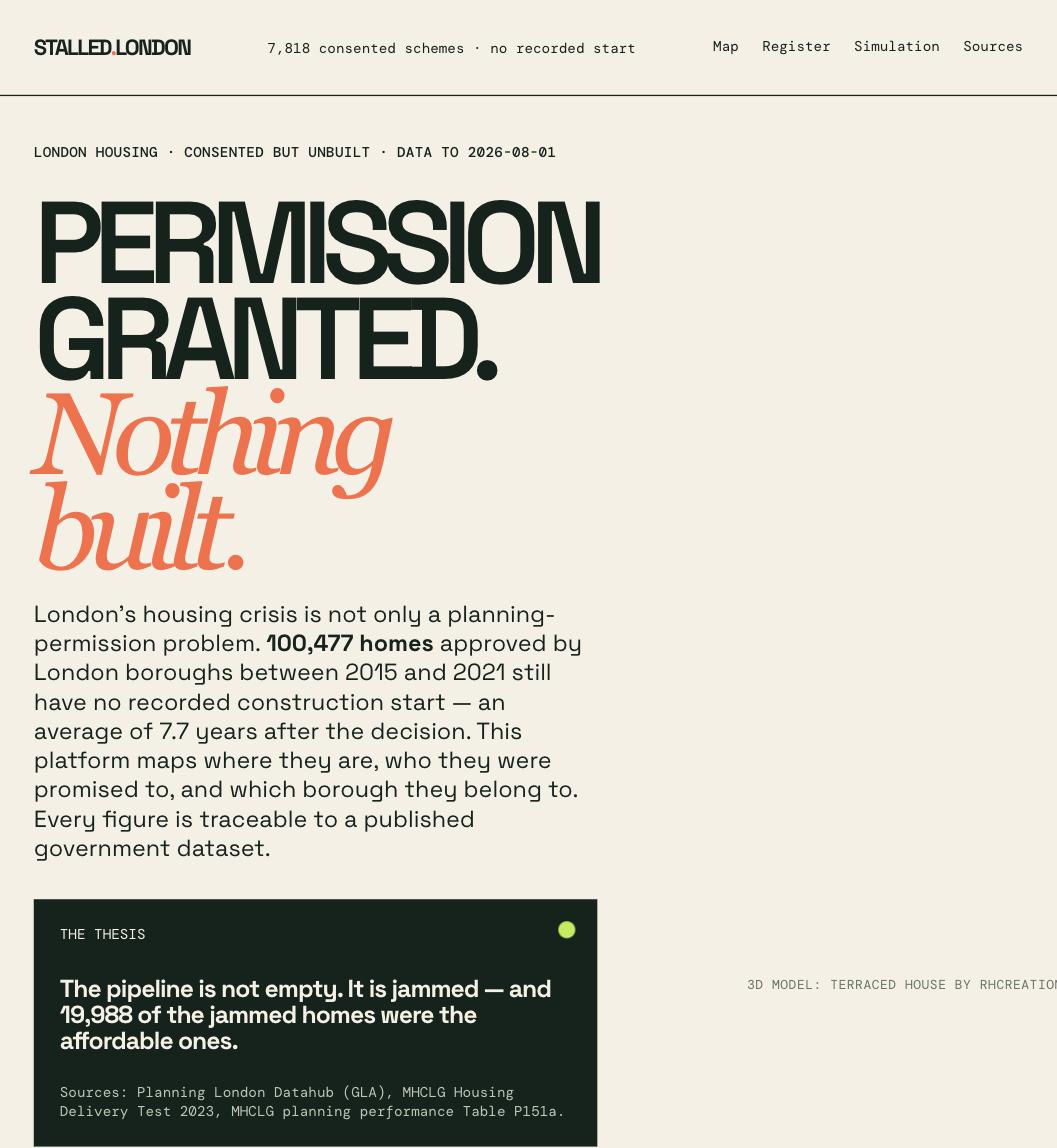
100,477 homes approved by London boroughs between 2015 and 2021 have no recorded construction start, an average of 7.7 years after decision; 19,988 of those are affordable units. The most visually polished, "product," submission of the eight, presenting a headline number, a choropleth map, a filterable register, and a price-simulation module.
Key finding: consistent with London Land Ledger's independently-sourced estimate from a different dataset, though this session's follow-up found both headline figures are probably somewhat overstated. The public repo doesn't include the extraction or join scripts, the weakest submission of the eight on methodological transparency specifically because it's the strongest on production polish.
Live site · GitHub
8. TA Watch
Brief inferred: PD · React 19 + Vite + Tailwind
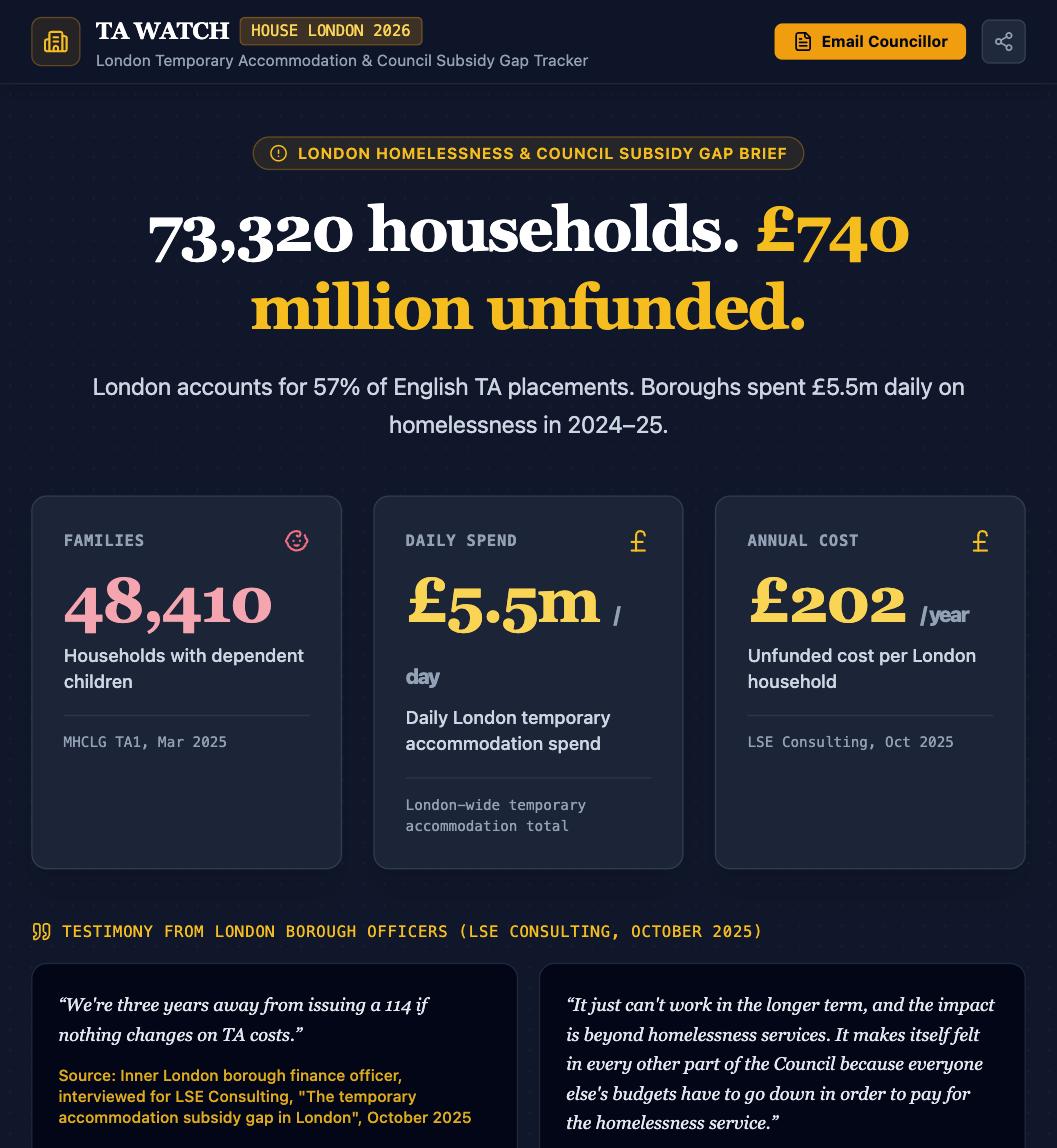
Councils are not mismanaging temporary-accommodation spending: they are structurally guaranteed to lose about £5,200 a year on every placed household because the central government subsidy has been capped at January-2011 housing-benefit rates for fourteen years while rents rose. Merging two tables an LSE Consulting report never joined shows the escape route: boroughs that place families in their own stock (exempt from the frozen-rate cap) lose roughly half as much per household as boroughs that don't (£6,688 vs £12,062/household/year, r=−0.62).
Key finding: a falsification check rules out "some boroughs just buy pricier rooms" as the driver (r=−0.05 for nightly-paid share vs. cost). Proposes three reforms ordered by implementation speed, from a one-line change to secondary legislation up to long-term capital funding for boroughs to buy their own stock.
Live site · GitHub (private: WhereToBuild data use restrictions)
Cross-cutting observations
Three independent teams converged on the same underlying claim, that London's binding constraint in several boroughs is what happens after permission, not permission itself, via three different datasets (London Land Ledger: national brownfield register; Stalled London: Planning London Datahub; Homes vs Hotels: GLA completions data) and two different framings. None of the three cite each other; this is a cross-validated finding reached independently under hackathon time pressure, which strengthens it.
Rigor varied far more than polish did. The Spike, London Land Ledger, and TA Watch each carry explicit, numbered limitations sections, stated data-quality gates, and falsification or robustness checks. Stalled London, and to a lesser extent Where Should London Build?, are the most production-polished but the least methodologically transparent, plausible and partly corroborated by the more rigorous submissions, but not independently auditable from what's published. Borough Approval Rate Analysis is the inverse case: no polish at all, but a fully transparent, re-runnable single regression.
Two genuinely different planning-data sources are in play across these projects: PlanIt (The Spike, Borough Approval Rate Analysis) and the official Planning London Datahub (London's Housing Pipeline, and cited by Stalled London and TA Watch). The PLD-based submissions independently lean on exactly the fields, construction lifecycle, developer identity, that PlanIt structurally can't provide.